
Masterclass
Data-driven presentations: Beyond the deck
AI can draft your slides, but it can’t finish them. See how Grunt ONE keeps presentations editable in PowerPoint, your AI chat and on the web.
15-10-2026
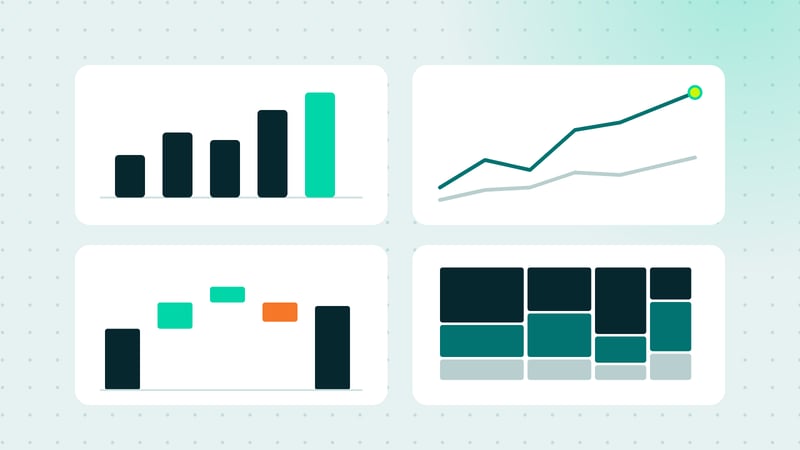
As visually oriented beings, humans tend to understand relationships in data much better if they've been properly visualized. Charting, when done right, is a highly effective tool for doing data ...
AI can draft your slides, but it can’t finish them. See how Grunt ONE keeps presentations editable in PowerPoint, your AI chat and on the web.
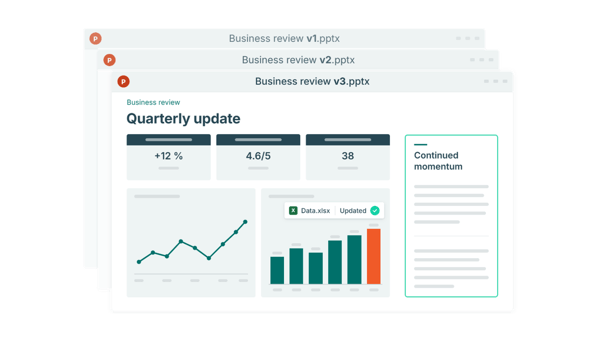
Streamline recurring presentations by connecting PowerPoint to Excel, reusing content and minimizing manual updates, so you can focus on key insights.
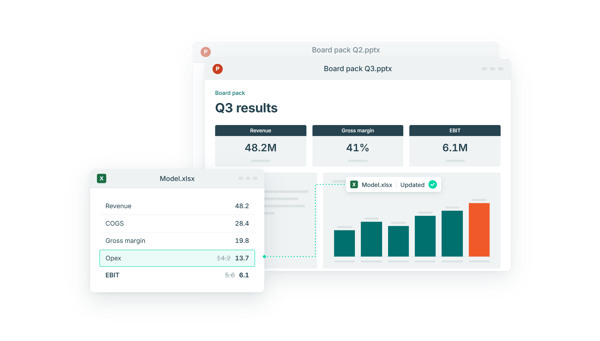
Why recurring reporting still takes hours, and four practical ways to cut the manual work by linking the charts and tables in your deck to Excel.

AI can draft text and build whole presentations. But teams need decks they can keep working on after the draft. Here’s why most AI slide tools fall sh...

With Grunt AI you can bulk-generate editable charts and slides directly from Excel and keep everything fully editable and connected to underlying data...
In this 5-minute walkthrough, we show you exactly how Grunt AI updates charts and generate insights directly from your Excel data.

Grunt AI generates charts and slides in PowerPoint from your source documents. Editable, on-brand, and connected to Excel.
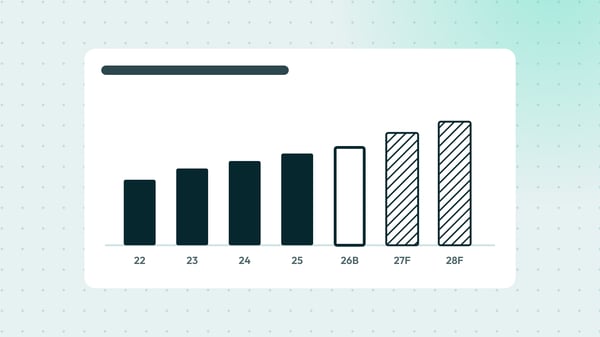
How to show actuals, budget and forecasts in one chart so your board reads them correctly: solid, outlined and hatched, with one rule for each.

Streamline financial reporting by moving from manual workflows to a scalable process that reduces errors and supports faster, more reliable updates.
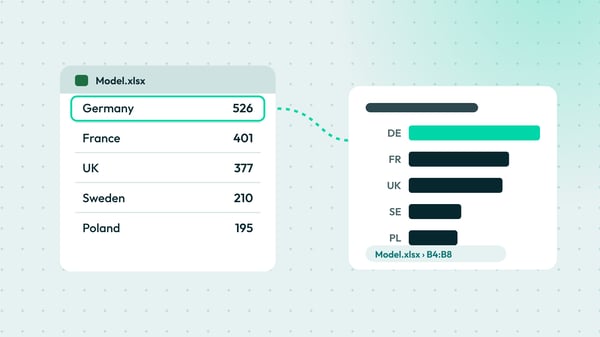
Let AI decide what to show and let the data supply the numbers. A practical guide to traceable numbers in AI-built board packs, reports and deal decks...

How consultants build presentations that lead to a decision: a clear storyline, one message per slide and charts that stay linked to the data.
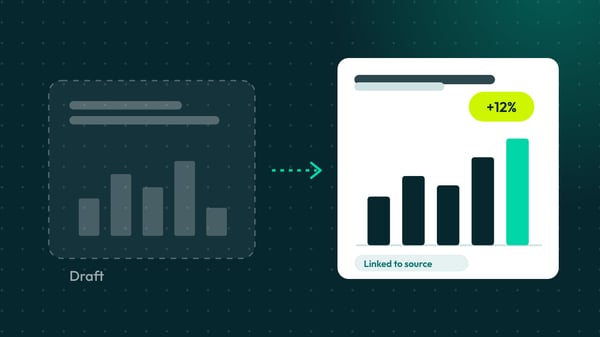
AI drafts presentations in minutes, yet teams still rebuild the charts and check every number by hand. Where the last mile goes, and how to close it.

Explore how Grunt and Microsoft's Copilot are revolutionizing PowerPoint with AI, enhancing user experience, and addressing professional needs.
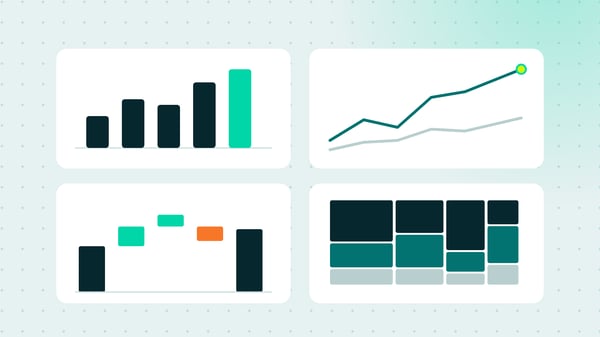
How to choose the right chart for your data: comparison, composition, relationship and distribution charts, and design pitfalls to avoid in business d...

This blog explores the strategies needed to excel in high-pressure scenarios when working as a business consultant trying to create quality presentati...

Time spent on slide formatting and manual fixes in PowerPoint is time taken from strategic work. See what it costs, and what you can do about it.

In this blog post, we will provide the twelve best tips and tricks from ex-consultants to create stunning slides and maximize the impact of your data.

We take you through all the steps from chart disaster to professional business charting.


