In short
Most firms now have Claude, ChatGPT or Copilot, and the AI drafts the storyline, the text and a first analysis in minutes. The time goes into the last mile: rebuilding charts to the firm's standard, checking every number against the source and making small changes without starting over. Closing that gap takes tooling around the AI, not a better prompt.
Ask anyone who builds board packs, deal decks or client reports how AI has changed their week, and you often hear the same answer. The first draft takes minutes. The finished deck still takes the evening.
That gap is the last mile of an AI-built presentation. It is where a firm's investment in AI either pays off or quietly leaks away.
Where the time goes after the draft
A business presentation is judged on its charts and its numbers, and those are the parts that most often get rebuilt by hand:
- Charts. A generated chart is usually a picture or a loose group of shapes. It rarely follows the firm's template, and changing one label can mean generating the whole chart again.
- Numbers. Figures get retyped from the model or regenerated with each new draft. Someone has to check every one against the source before the deck goes out.
- Small changes. Re-sort the bars, highlight one market, move a label. In a slide built from shapes, each of these is a manual job, or another prompt that redraws everything.
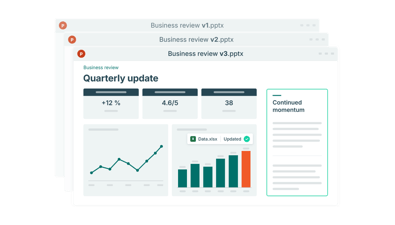
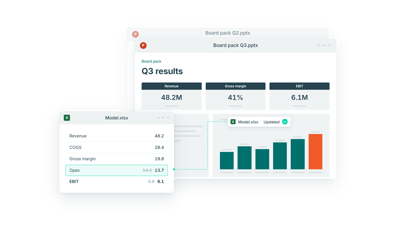
- Updates. When the model changes two days before the deadline, every affected chart has to be found and fixed again.
None of this is a failing of the AI. Language models are built to write and reason. Keeping a chart tied to an Excel range, or promising that a number did not move when you asked for a different color, is a job for tooling, not intelligence.
Why a better model will not close the gap on its own
Models improve every few months, and each one writes a better draft. But the last mile is not about writing. It needs three things a model does not provide by itself:
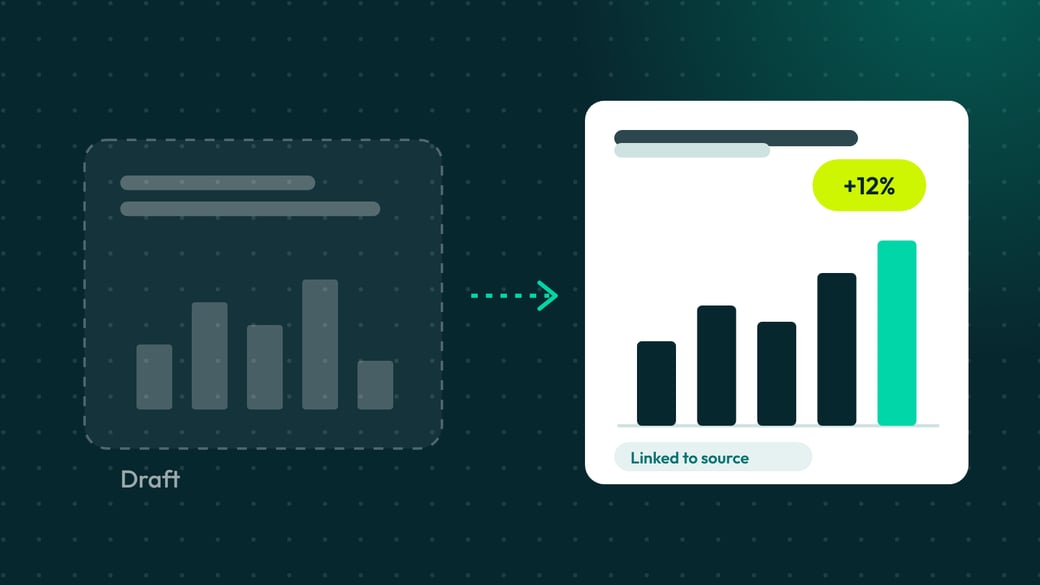
- A chart that is an object, not a picture. When the chart carries its own data and rules, you can change one thing without rebuilding it.
- Numbers that come from the source. When a chart is linked to the data, refreshing it does not involve the model at all. There is nothing to regenerate and nothing to retype.
- Control at the end. The person responsible for the deck needs to make the final changes precisely, by hand or with a short prompt, and see exactly what changed.
What closing the last mile looks like
The practical answer is to let the AI do what it does well and give it the right tools for the rest. In a typical workflow:
- Your AI drafts the storyline and proposes which charts make the point.
- The charts are built as business charts, such as waterfalls, Mekko charts and combined charts, on the firm's template.
- The numbers come from the source, an Excel range or data your team has supplied, so anyone can trace a figure back.
- Final changes are precise: a label, a sort order, one highlighted value, by hand or by prompt.
- When the data changes, linked charts refresh in one click, with no prompt and no tokens spent.
Then test the result with one question: could this deck go to a client or a board without anything being rebuilt? If the answer is no, the last mile is still manual.
How Grunt fits
Grunt is the chart and data layer for AI-built business presentations. It works with the AI your firm already uses, Claude, ChatGPT or Copilot, and gives it purpose-built business charts and tables. Every number is traceable to its source, small changes stay small, and the same chart can be built once and edited in PowerPoint, in HTML reports or inside the AI chat.