Visualizing time-series data is a persistent struggle for finance teams. When actuals, budgets, and forecasts are combined in a single chart, the visuals can quickly become unclear.
Analysts often resort to manually highlighting single columns, but this often adds confusion rather than clarity. Time-based chart formatting cleanly differentiates actuals, budgets, and forecasts to maintain executive clarity.
How do you visualize actuals, budget and forecast in PowerPoint?
Actuals, budgets and forecasts represent different types of data, and should not be displayed in the same way. If they have the same styling, it’s harder for your audience to interpret what they’re seeing.
A more effective approach is to visualize it in a way that clearly differentiates each data type, while still maintaining a clean and unified design.
Here is a simple framework for styling time-based charts:
-
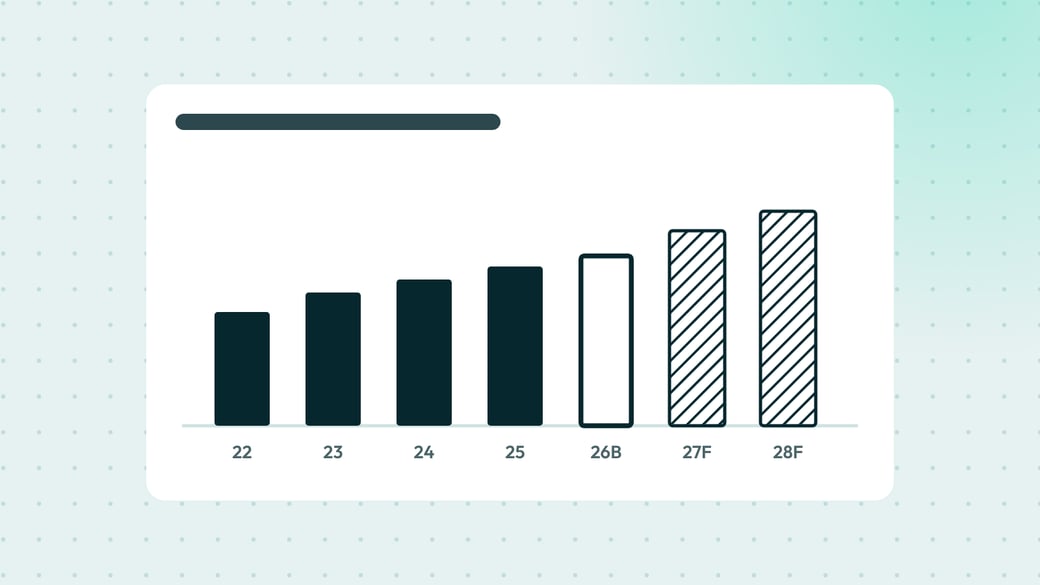
Ground your actuals. Use a solid fill color to anchor historical data.
-
Frame your budgets. Use a solid outline with no fill to define approved targets.
-
Project your forecasts. Use a hatch brush pattern to visualize future expectations.
| Data type | Visual rule | Objective |
| Actuals | Solid fill | Grounds historical data |
| Budgets | Solid outline | Frames approved targets |
| Forecasts | Hatch brush | Projects future expectations |
By applying this consistent design, your audience can immediately recognize what type of data they are looking at. The same convention is used in ISO 24896, the standard for business reporting visuals.
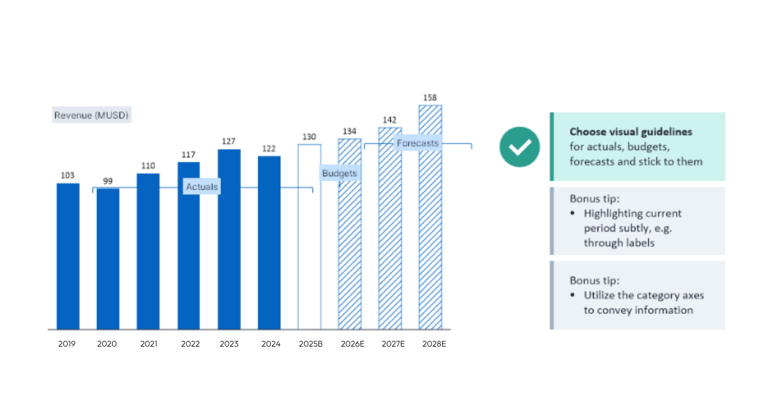
For additional clarity, you should also add subtle labels such as “B” for budget and “E” or “F” for the forecast directly to the axis.
How can you automate Excel data formatting in presentations?
Styling columns one by one is slow, and it has to be redone the next time the data changes. In Grunt, you define the intent of the formatting once instead of styling individual elements.
You can set Formatting Rules to automatically adapt chart visuals based on specific cell data.
Excel connections link each chart to a range in your workbook, so the numbers come from the source rather than from copy and paste.
When the workbook changes, Grunt tells you fresh data is available, and you update the slide in one click. Because the styling follows rules rather than manual formatting, it stays consistent when a new period moves from forecast to actual.
Present your business insights with memorable charts
The example above illustrates how small design choices, such as using fill, outlines, and patterns, can significantly improve how your data is understood.
Watch our masterclass Memorable Charts: How to present your business insights to learn how to present your data so your audience quickly understands what matters, and remembers it.